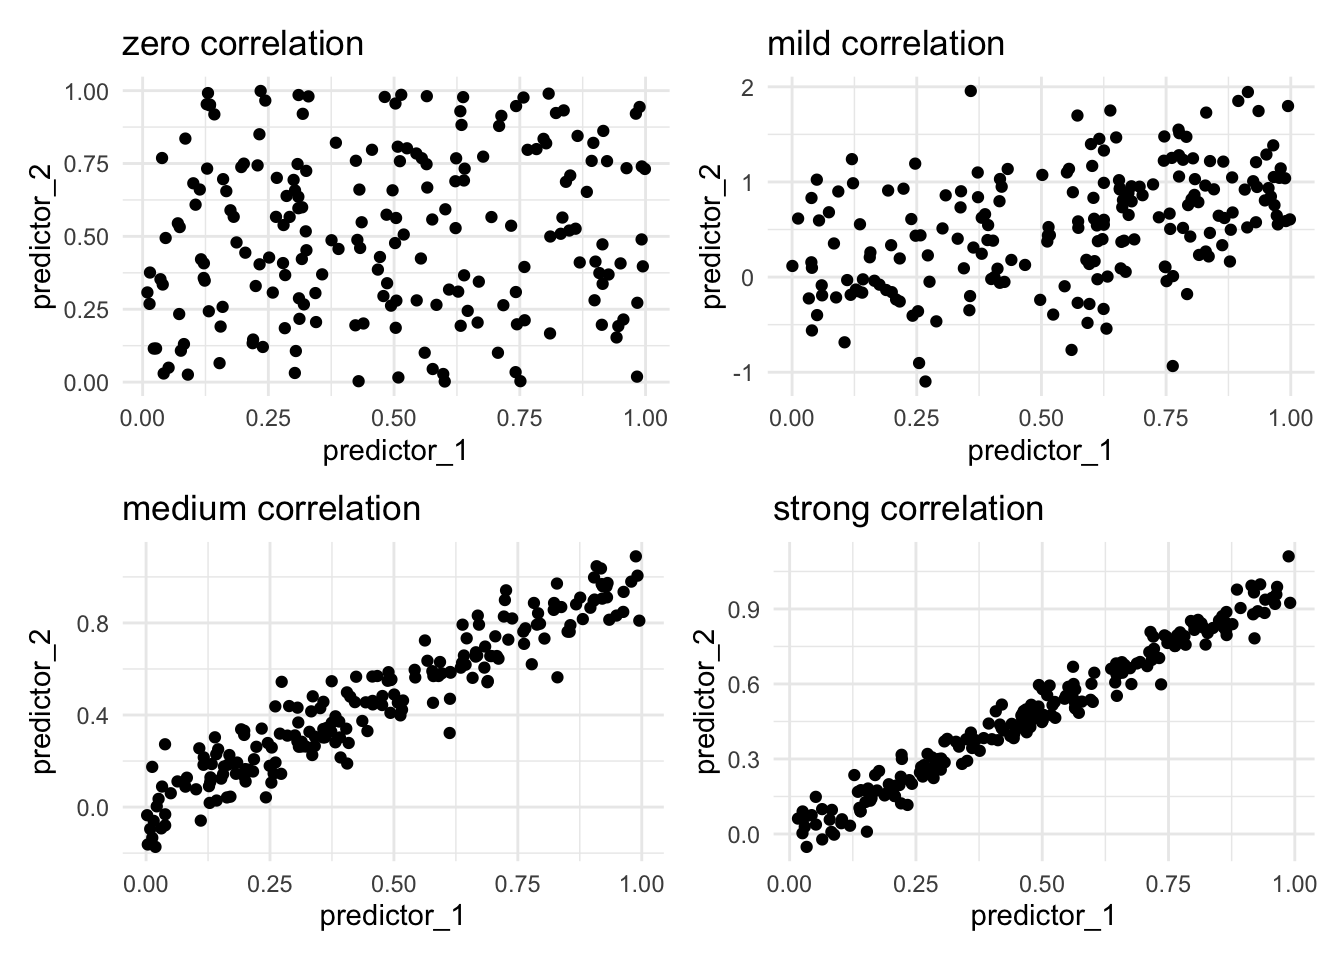
Correlation happens when two or more variables contain similar information. We typically refer to correlation when we talk about predictors. This can be a problem for some machine learning models as they don’t perform well with correlated predictors. There are many different ways to calculate the degree of correlation. And those details aren’t going to matter much right now. The important thing is that it can happen. Below we see such examples
The reason why correlated features are bad for our models is that two correlated features have the potential to share information that is useful. Imagine we are working with strongly correlated variables. Furthermore, we propose that predictor_1 is highly predictive in our model, since predictor_1 and predictor_2 are correlated, we can conclude that predictor_2 would also be highly predictive. The problem then arises when one of these predictors is used, the other predictor will no longer be a predictor since they share their information. Another way to think about it is that we could replace these two predictors with just one predictor with minimal loss of information. This is one of the reasons why we sometimes want to do dimension reduction, as seen in Chapter 66.
We will see how we can use the correlation structure to figure out which variables we can eliminate, this is covered in Chapter 80. This is a more specialized version of the methods we cover in Chapter 78 as we are looking at correlation to determine which variables to remove rather than their relationship to the outcome.
Another set of methods that works well in anything PCA-related, which are split into two chapters, one explaining PCA and one going over PCA varients. The resulting data coming out of PCA will be uncorrelated.