42 Missing Overview
42.1 Missing Overview
Missing data is sometimes hard to avoid. So we will have to work to deal with them. This is something we can’t avoid since many implemented models are not set up to work with missing data and will error if it encounters them.
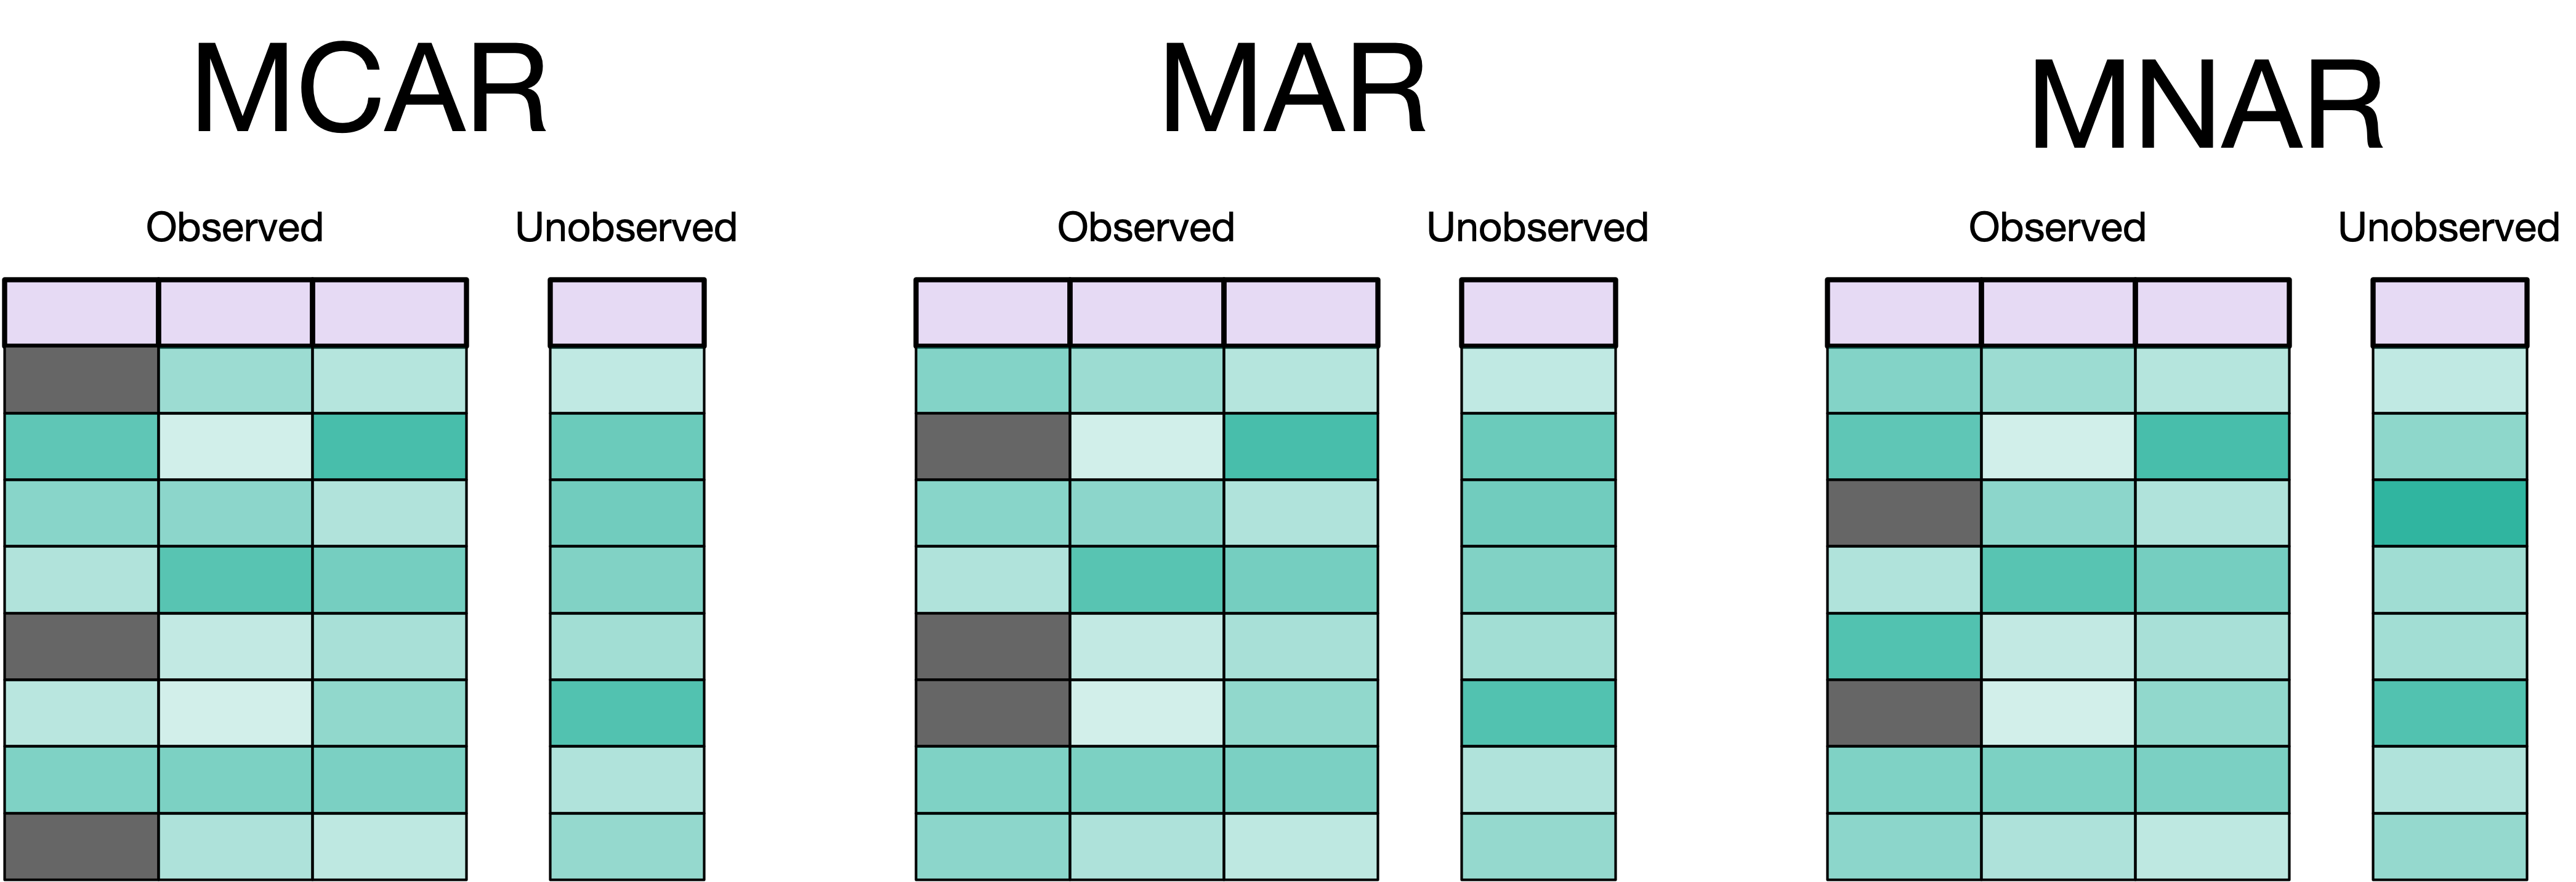
We have different ways data can be missing. It is important to identify which type it is as it will change how we should deal with it. The 3 types we will consider are Missing Completely At Random (MCAR), Missing At Random (MAR), and Missing Not At Random (MNAR) (RUBIN 1976).
When data is MCAR, then we have that the missingness is unrelated to anything else in our data set or other relevant information. This is the cleanest form of missingness as if a truly random die was rolled for each value to determine whether a value should be marked as missing or not. This type of missing data doesn’t contain any information, and our method of remedying it is about causing the least destruction. Data are very rarely missing completely at random.
When data is MAR, then the missingness is related to the observed data but not the unobserved data. We can find this type of missingness by looking at the relationship between the missingness and the observed data we have. If we are collecting reviews from hotel stays, we might imagine that satisfaction with the stay is related to how much information we get in other fields. This is a much bigger class of missingness than MCAR and something we can find good remedies for. Most methods that try to deal with missing data assume the data is MAR.
Lastly, we have MNAR. This happens when neither MCAR nor MAR holds. Rephrased, this happens when the missingness isn’t related to anything we have observed. An example of this is an instrument that wears over time, giving higher and higher probabilities of producing missing values. If we don’t know and measure this, then we have data that are MNAR. MNAR might feel like MCAR, so our main goal is to figure out if it is or not. This should all be done at the EDA stage.
Another wrinkle to missingness is that we can have a combination of the above methods. This is happening because we see missingness in two ways, observation-wise and column-wise. For observation missingness, the whole observation is missing. E.I. all the values for the observation are missing, maybe except for the ID. For column missingness, it is the values of a given feature that can be missing or not. You could imagine a data set where some columns are MCAR while others are MAR. We need to treat the columns accordingly.
How and why the data might be missing will require investigation and domain knowledge, both of which this book won’t be able to give you. What the following chapters will show you, is the ways to deal with the missingness, once you find out what measure is appropriate.
Depending on what type of missing data you have, and the access to the data-generating process. You might be able to improve your collected data to fill in the blanks. Suppose that some of your data comes from OCR1 from some documents. If the original images are still available and the missing values could be removed by changing the settings then we can deal with the missing values directly. You might even be able to manually correct missing data.
The following chapters assume that the reader has identified missing values. Sometimes they are easily labeled as NA in your code and database. but creativity knows no bounds, which sadly has influenced some users in their way of identifying missing values. Common values are -9, 9999, and 9000. If you are lucky, then you can find this information in the data dictionary, but sometimes you need to be in contact with the people in charge of data collection. To make matters more complicated, there will also be times when different types of missingness will be encoded differently, such as 9000 for machine failure, and 9001 for missing sheet.
42.2 Imputation
One of the most common ways of dealing with missing values is to fill them in with some values. The types of methods that do this can be split into two groups. Simple Imputation is when you use the values in the variable to impute its missing values, which is where mean and mode imputation are found. Anything more complicated than this will be found in the Model Based Imputation. This is where multiple columns are used to determine the type of imputation needed.
42.3 Indication
If you suspect that the data is not missing at random, it might be worthwhile to include the missingness as an indicator in your data. We will see how we can do that in Chapter 45.
42.4 Removal
As a last resort, you might want to remove variables or rows with missing data, we will see how that is done in Chapter 46. This chapter is put last in this section, as it is generally not the preferred action, and all other avenues should be considered before removal is done.
Optical Character Recognition is used to extract text from images.↩︎