81 Outliers Overview
81.1 Outliers Overview
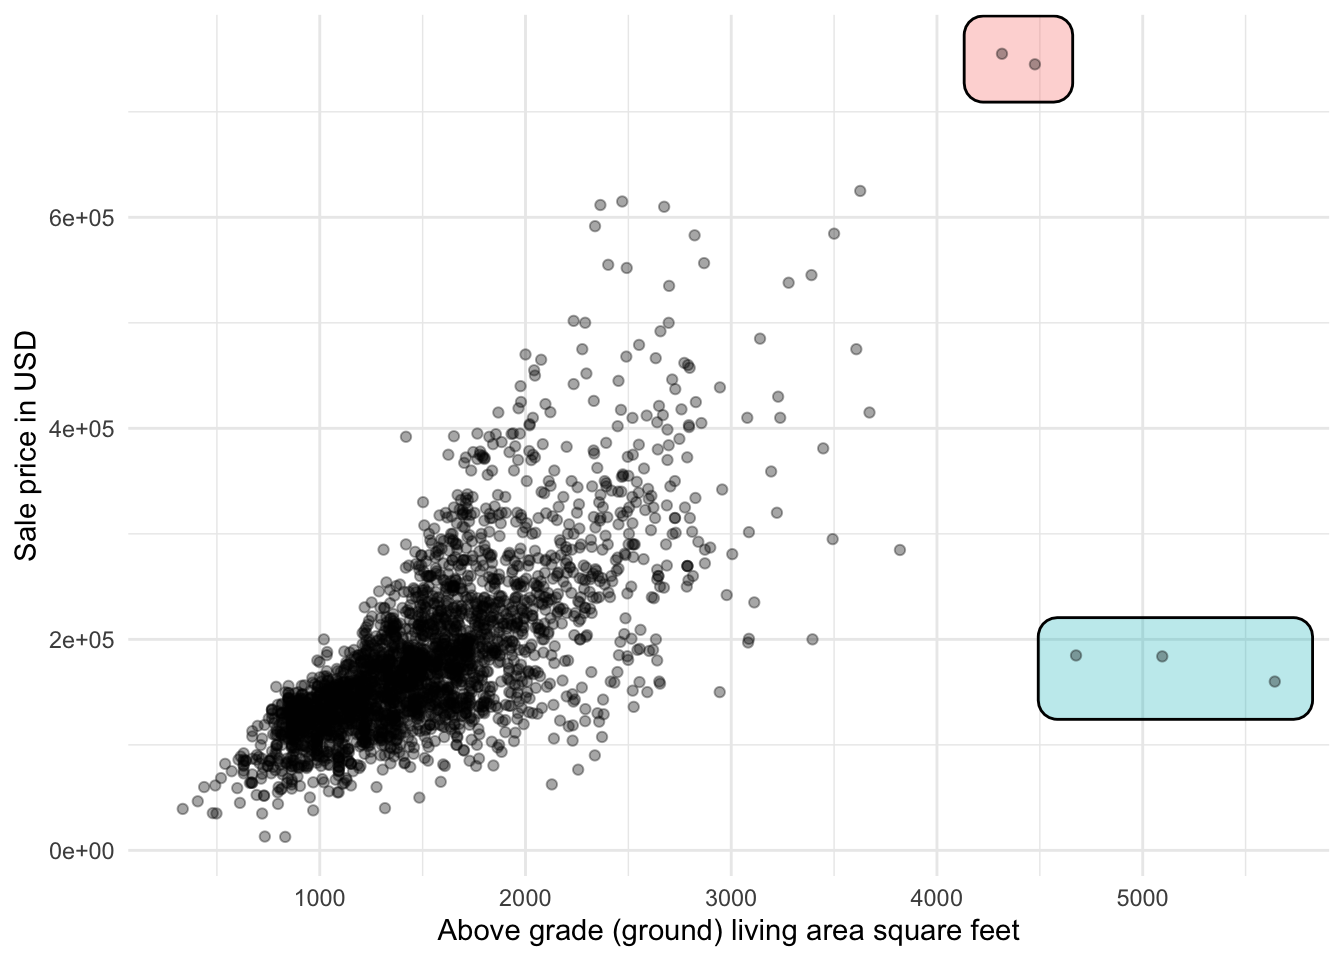
When we talk about outliers, we mean values that are different from the rest of the values. This is typically seen as extreme values. Let us talk about it with an example first. Below is the famous Ames housing data set. We have plotted the living area against the sale price.
Two groups of observations appear to be quite far away from the rest of the points. We are in luck as these points are discussed in the data directory. The relevant quote is shown below:
There are 5 observations that an instructor may wish to remove from the data set before giving it to students (a plot of SALE PRICE versus GR LIV AREA will indicate them quickly). Three of them are true outliers (Partial Sales that likely don’t represent actual market values) and two of them are simply unusual sales (very large houses priced relatively appropriately).
These types of points would typically be called outliers. They are different enough from the rest of the observations. “Different enough” is by itself hard to define. And we won’t try in this book. What we will show is some ways that people define it and let you decide what is best for your data about treatment.
In this care, we had enough domain knowledge to be able to determine the reason for these points to be outliers, and how to deal with them. We won’t always be this lucky. These points were outliers in 2 ways. 3 of the points didn’t include the full price of the house, so it could be classified as an error. If we think of this data set as “houses with know full prices” then we could exclude them as not fitting that criteria. The other two houses are outliers in a purely numerical sense. They take values that are much more different than the rest of the observations.
When you systematically remove observations, regardless of whether you think they are outliers or not. Then you are limiting the domain where your model is expected to work. This may be fine or not, it will depend on the specific problem you working on. But be very careful not to remove actual observations from your data.
We have a handful of different ways to deal with outliers. the first choice is to not. Some model types don’t care about outliers that much. Anything that uses distances is very affected by outliers. Tree-based models don’t. Some other preprocessing method such as Robust Scaling also isn’t affected by outliers.
If you are planning on handling outliers you want to start by identifying them. This will very briefly be covered in the outliers identify chapter. The remaining chapters will cover how we can deal with the outliers once we find them. In the chapter Outlier removal we look at how we can remove outliers. In the outliers issues section we cover numerical transformations that lessen the effect that outliers have on the distribution. Instead of removing the specific observation that has outliers, or transforming the whole variable, we can choose to only modify the value of the outliers. We look at methods on how to do that in the Outliers Imputation chapter. In addition to all of these methods, we can also add additional indicator variables to denote whether an observation is an outlier or not, this is covered in the Outliers Indicate chapter.
Lastly, it might be appropriate to treat the outliers as a separate data set and fit a specific model to that part of the data.