46 Remove Missing Values
46.1 Remove Missing Values
Removing observations with missing values should generally be considered the last resort. This will of course depend on your data and practices, and there are cases where it is appropriate.
Nevertheless, the removal of observations should be done with care. Especially since the removal of observations means that no prediction will happen to them. This might be unacceptable, and you need to make sure proper procedure is taken to guarantee that all observations are predicted. Even if removed observations are given default values for predictions.
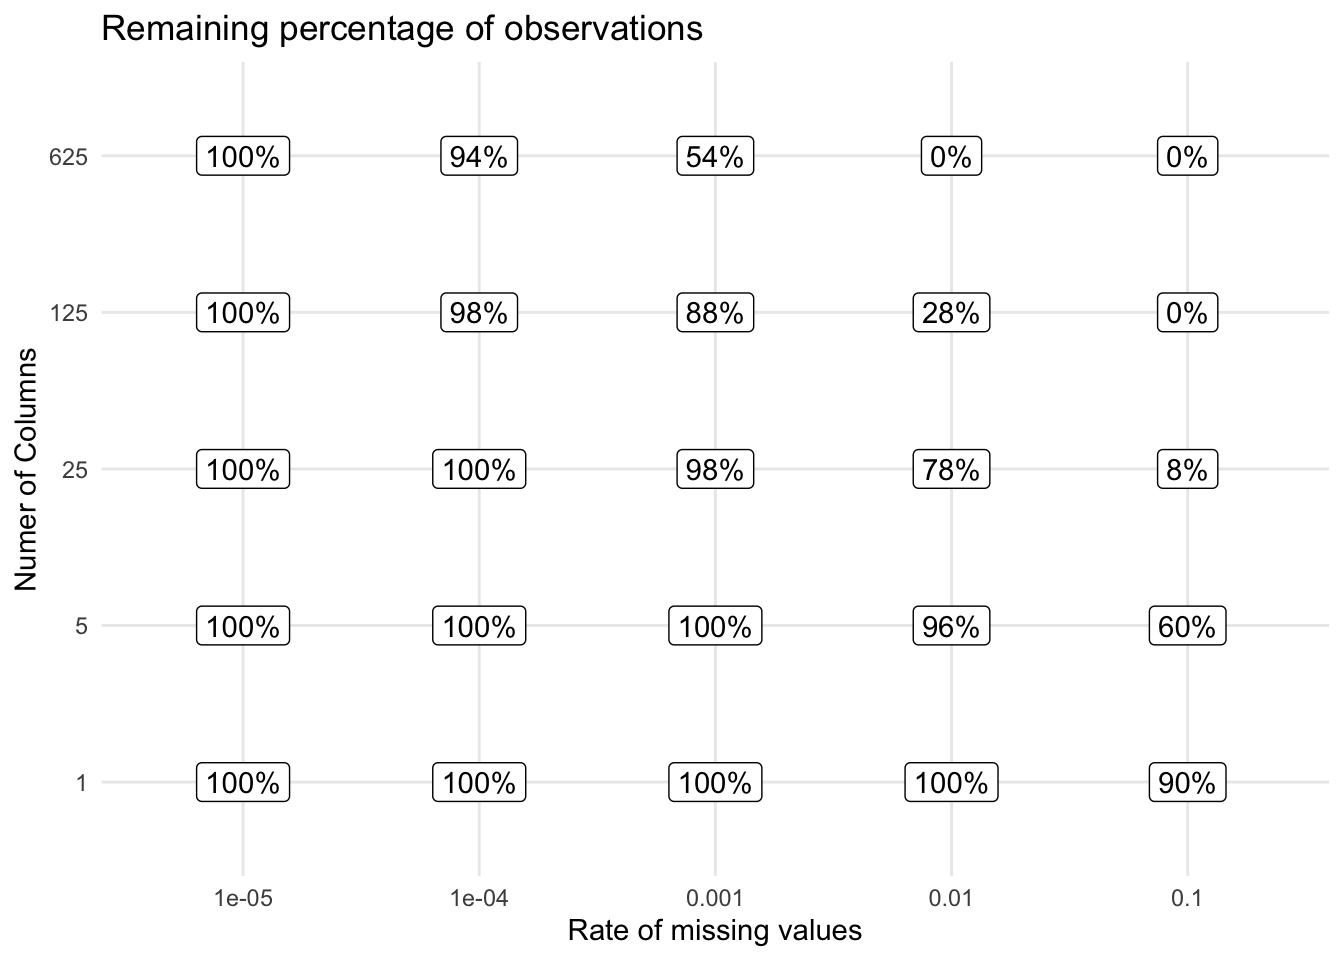
The most simple way to do missing value removal is to remove observations that experience any number of missing values. It is straightforward to do and implemented in any modeling software you use. The downside to this is that if you are seeing a little bit of missing data, across your predictors, you end up throwing away a lot of data once you have a lot of columns.
This can also happen with missingness that clusters in certain groups of variables. Remember to always look at how many observations you are losing by doing the removals.
We are removing observations for one of two reasons. The first reason is that it messes with our model’s ability to fit correctly. If this is the issue we should think about other methods in the Missing section than removal. Another reason why we want to remove observations is because they don’t have enough information in them because of their missingness.
Imagine an observation where every single field is missing. There is no information about the observation other than the fact that it is fully missing. On the other end of the spectrum, we have observations with no missing values at all. Somewhere between these two extremes is a threshold that we imagine defines “too much missing”. This is the basis behind threshold-based missing value removal we define a threshold and then remove observations once they have more than, say 50% missing values. This method by itself doesn’t deal with all the missing values and would need to be accompanied by other methods as described in the Missing section. This threshold will need to be carefully selected, as you are still removing observations.
In the same vein as above, we can look at removing predictors that have too many missing values. This is a less controversial option that you can explore. As for its use. It is still recommended that you do it in a thresholded fashion. So you can set up your preprocessing to remove predictors that have more than 30% or 50% missing values. Again this value will likely have to be tuned. The reason why this method isn’t as bad is that we aren’t removing observations, we are instead trying to remove low information predictors. This is not a foolproof method, as the missingness could be non-MCAR and be informative.
46.2 Pros and Cons
46.2.1 Pros
- Will sometimes be necessary
46.2.2 Cons
- Extreme care has to be taken
- Loss of data
46.3 R Examples
CautionTODO
find data set
We can use the step_naomit() function from the recipes package to remove any observation that contains missing values.
library(recipes)

naomit_rec <- recipe(~., data = mtcars) |>
  step_naomit(all_predictors()) |>
  prep()

bake(naomit_rec, new_data = NULL)
# A tibble: 32 × 11
mpg cyl disp hp drat wt qsec vs am gear carb
<dbl> <dbl> <dbl> <dbl> <dbl> <dbl> <dbl> <dbl> <dbl> <dbl> <dbl>
1 21 6 160 110 3.9 2.62 16.5 0 1 4 4
2 21 6 160 110 3.9 2.88 17.0 0 1 4 4
3 22.8 4 108 93 3.85 2.32 18.6 1 1 4 1
4 21.4 6 258 110 3.08 3.22 19.4 1 0 3 1
5 18.7 8 360 175 3.15 3.44 17.0 0 0 3 2
6 18.1 6 225 105 2.76 3.46 20.2 1 0 3 1
7 14.3 8 360 245 3.21 3.57 15.8 0 0 3 4
8 24.4 4 147. 62 3.69 3.19 20 1 0 4 2
9 22.8 4 141. 95 3.92 3.15 22.9 1 0 4 2
10 19.2 6 168. 123 3.92 3.44 18.3 1 0 4 4
# ℹ 22 more rows
CautionTODO
wait for thresholded observation removal
There is the step_filter_missing() function from the recipes package that removes predictors with more missing values than the specified threshold
library(recipes)

filter_missing_rec <- recipe(~., data = mtcars) |>
  step_filter_missing(all_predictors()) |>
  prep()

bake(filter_missing_rec, new_data = NULL)
# A tibble: 32 × 11
mpg cyl disp hp drat wt qsec vs am gear carb
<dbl> <dbl> <dbl> <dbl> <dbl> <dbl> <dbl> <dbl> <dbl> <dbl> <dbl>
1 21 6 160 110 3.9 2.62 16.5 0 1 4 4
2 21 6 160 110 3.9 2.88 17.0 0 1 4 4
3 22.8 4 108 93 3.85 2.32 18.6 1 1 4 1
4 21.4 6 258 110 3.08 3.22 19.4 1 0 3 1
5 18.7 8 360 175 3.15 3.44 17.0 0 0 3 2
6 18.1 6 225 105 2.76 3.46 20.2 1 0 3 1
7 14.3 8 360 245 3.21 3.57 15.8 0 0 3 4
8 24.4 4 147. 62 3.69 3.19 20 1 0 4 2
9 22.8 4 141. 95 3.92 3.15 22.9 1 0 4 2
10 19.2 6 168. 123 3.92 3.44 18.3 1 0 4 4
# ℹ 22 more rows46.4 Python Examples
I’m not aware of a good way to do this in a scikit-learn way. Please file an issue on github if you know of a good way.