44  Model Based Imputation

In model-based imputation, this is where we get the remaining types of imputation that we can use. It is quite a big and broad topic. This chapter will try to do it justice.

We start with simpler methods. Remember, this chapter specifically refers to methods where more than one variable is being used for the imputation. So we could do grouped versions of the simple imputation methods seen in Chapter 43. Instead of imputing with the mean, you impute with the mean within a given group as defined by another categorical variable.

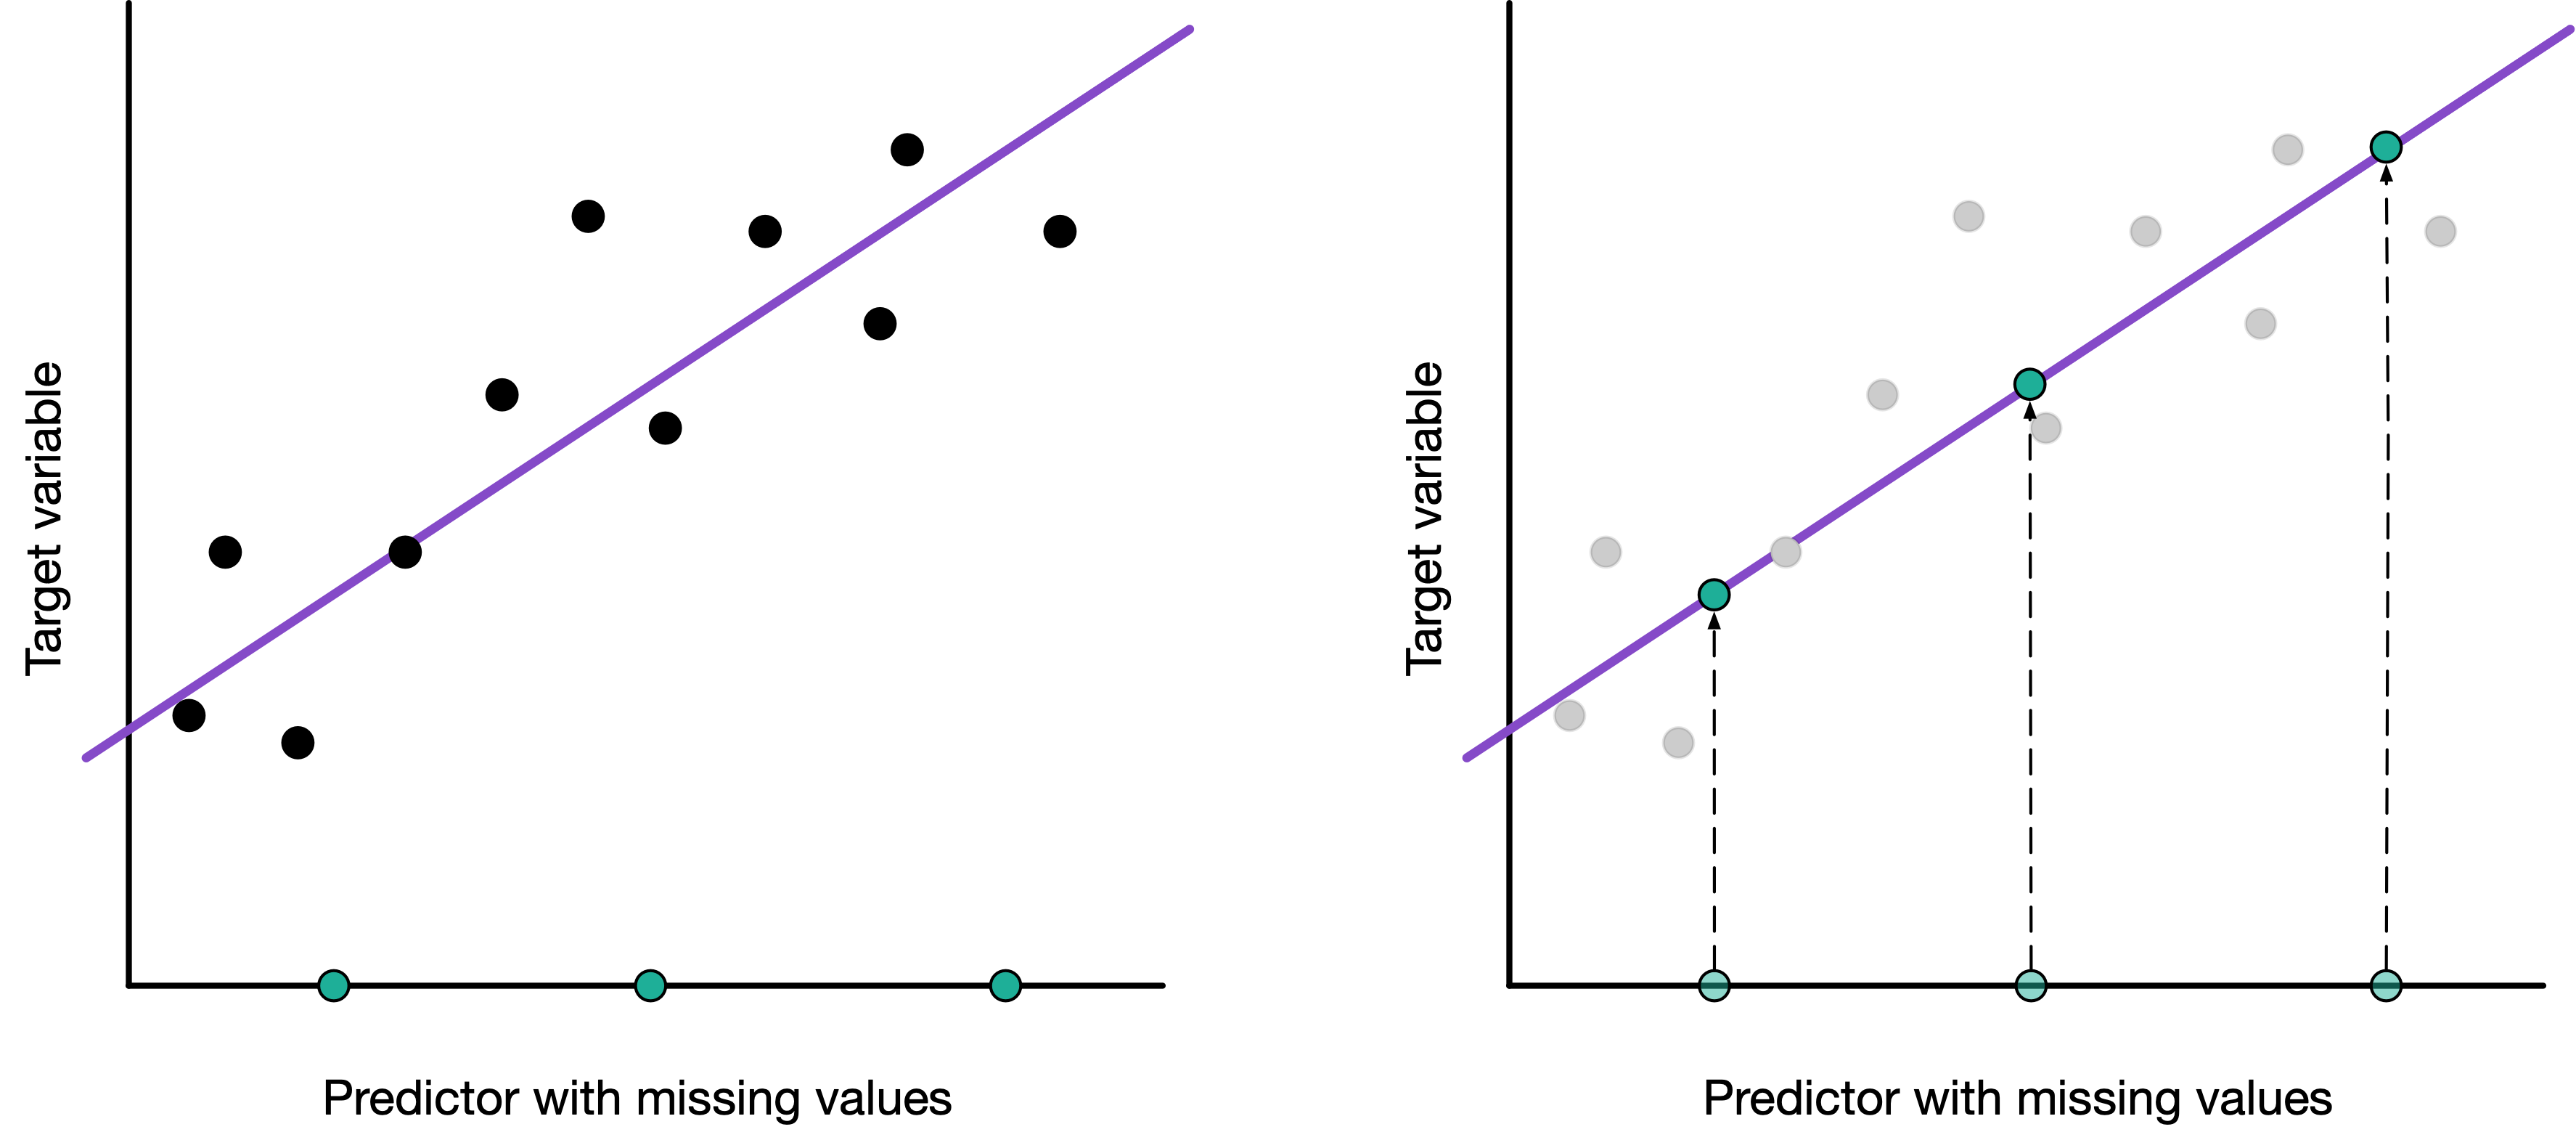
You could also fit a linear regression model with the target variable as the variable you intend to impute, and other complete variables as predictors.

Figure 44.1: linear imputation in action. The left-hand side shows the linear fit between a predictor and the target variable. Missing values are shown along the x-axis. The right-hand side shows how the missing values are being imputed using the linear fit.

This idea will extend into most other types of models. K-nearest neighbors and trees are common models for this task. For these models, you need to make sure that the predictors can be used. So they will need to not have any missing values themselves. You could in theory use a series of models you impute variables with missing data, which then will be used as predictors to predict another variable.

Methods such as Multivariate Imputation by Chained Equations(Buuren 2012) also fall into this category of imputation as well.

44.2 Pros and Cons

44.2.1 Pros

  • Likely get better performance than simple imputation

44.2.2 Cons

  • More complex model
  • lower interpretability

44.3 R Examples

There are a number of steps in the recipes package that fall under this category. Within that, we have step_impute_bag(), step_impute_knn(), and step_impute_linear().

TODO

find a better data set

Below we are showing how we can impute using a K-nearest neighbor model using step_impute_knn(). We specify the variable to impute on first, and then with impute_with we specify which variables are used as predictors in the model.

library(recipes)

impute_knn_rec <- recipe(mpg ~ ., data = mtcars) |>
  step_impute_knn(disp, neighbors = 1, impute_with = imp_vars(vs, am, hp, drat))

impute_knn_rec |>
  prep() |>
  juice()
# A tibble: 32 Ɨ 11
     cyl  disp    hp  drat    wt  qsec    vs    am  gear  carb   mpg
   <dbl> <dbl> <dbl> <dbl> <dbl> <dbl> <dbl> <dbl> <dbl> <dbl> <dbl>
 1     6  160    110  3.9   2.62  16.5     0     1     4     4  21  
 2     6  160    110  3.9   2.88  17.0     0     1     4     4  21  
 3     4  108     93  3.85  2.32  18.6     1     1     4     1  22.8
 4     6  258    110  3.08  3.22  19.4     1     0     3     1  21.4
 5     8  360    175  3.15  3.44  17.0     0     0     3     2  18.7
 6     6  225    105  2.76  3.46  20.2     1     0     3     1  18.1
 7     8  360    245  3.21  3.57  15.8     0     0     3     4  14.3
 8     4  147.    62  3.69  3.19  20       1     0     4     2  24.4
 9     4  141.    95  3.92  3.15  22.9     1     0     4     2  22.8
10     6  168.   123  3.92  3.44  18.3     1     0     4     4  19.2
# ā„¹ 22 more rows

44.4 Python Examples

Iā€™m not aware of a good way to do this for models other than KNN in a scikit-learn way. Please file an issue on github if you know of a good way.

We are using the ames data set for examples. {sklearn} provided the KNNImputer() method we can use.

from feazdata import ames
from sklearn.compose import ColumnTransformer
from sklearn.impute import KNNImputer

ct = ColumnTransformer(
    [('na_indicator', KNNImputer(), ['Sale_Price', 'Lot_Area', 'Wood_Deck_SF',  'Mas_Vnr_Area'])], 
    remainder="passthrough")

ct.fit(ames)
ColumnTransformer(remainder='passthrough',
                  transformers=[('na_indicator', KNNImputer(),
                                 ['Sale_Price', 'Lot_Area', 'Wood_Deck_SF',
                                  'Mas_Vnr_Area'])])
In a Jupyter environment, please rerun this cell to show the HTML representation or trust the notebook.
On GitHub, the HTML representation is unable to render, please try loading this page with nbviewer.org.
ct.transform(ames)
      na_indicator__Sale_Price  ...  remainder__Latitude
0                     215000.0  ...               42.054
1                     105000.0  ...               42.053
2                     172000.0  ...               42.053
3                     244000.0  ...               42.051
4                     189900.0  ...               42.061
...                        ...  ...                  ...
2925                  142500.0  ...               41.989
2926                  131000.0  ...               41.988
2927                  132000.0  ...               41.987
2928                  170000.0  ...               41.991
2929                  188000.0  ...               41.989

[2930 rows x 74 columns]

The argument n_neighbors is something you might have to tune to get good performance for this type of imputing method.

ct = ColumnTransformer(
    [('na_indicator', KNNImputer(n_neighbors=15), ['Sale_Price', 'Lot_Area', 'Wood_Deck_SF',  'Mas_Vnr_Area'])], 
    remainder="passthrough")

ct.fit(ames)
ColumnTransformer(remainder='passthrough',
                  transformers=[('na_indicator', KNNImputer(n_neighbors=15),
                                 ['Sale_Price', 'Lot_Area', 'Wood_Deck_SF',
                                  'Mas_Vnr_Area'])])
In a Jupyter environment, please rerun this cell to show the HTML representation or trust the notebook.
On GitHub, the HTML representation is unable to render, please try loading this page with nbviewer.org.
ct.transform(ames)
      na_indicator__Sale_Price  ...  remainder__Latitude
0                     215000.0  ...               42.054
1                     105000.0  ...               42.053
2                     172000.0  ...               42.053
3                     244000.0  ...               42.051
4                     189900.0  ...               42.061
...                        ...  ...                  ...
2925                  142500.0  ...               41.989
2926                  131000.0  ...               41.988
2927                  132000.0  ...               41.987
2928                  170000.0  ...               41.991
2929                  188000.0  ...               41.989

[2930 rows x 74 columns]