14 Arithmetic
14.1 Arithmetic
With domain knowledge, we can generate quite good features by combining multiple existing numeric variables. This chapter is less about methods, but rather exploring and reinforcing the idea that powerful transformations can happen when you apply simple arithmetic operators carefully and thoughtfully.
An important kind of transformation we can get with arithmetic operators is ratios. Simply dividing two columns by each other can give us better insights than what we could get without them. The use of ratios is already common practice in most industries. What we are trying to do is identify them and apply them if they are not already there. Ratios come in many fashions such as the debt ratio (total debt/total assets), bathrooms-to-bedrooms ratio (number of bathrooms/bedrooms), and orders-to-reviews ratio (orders/reviews).
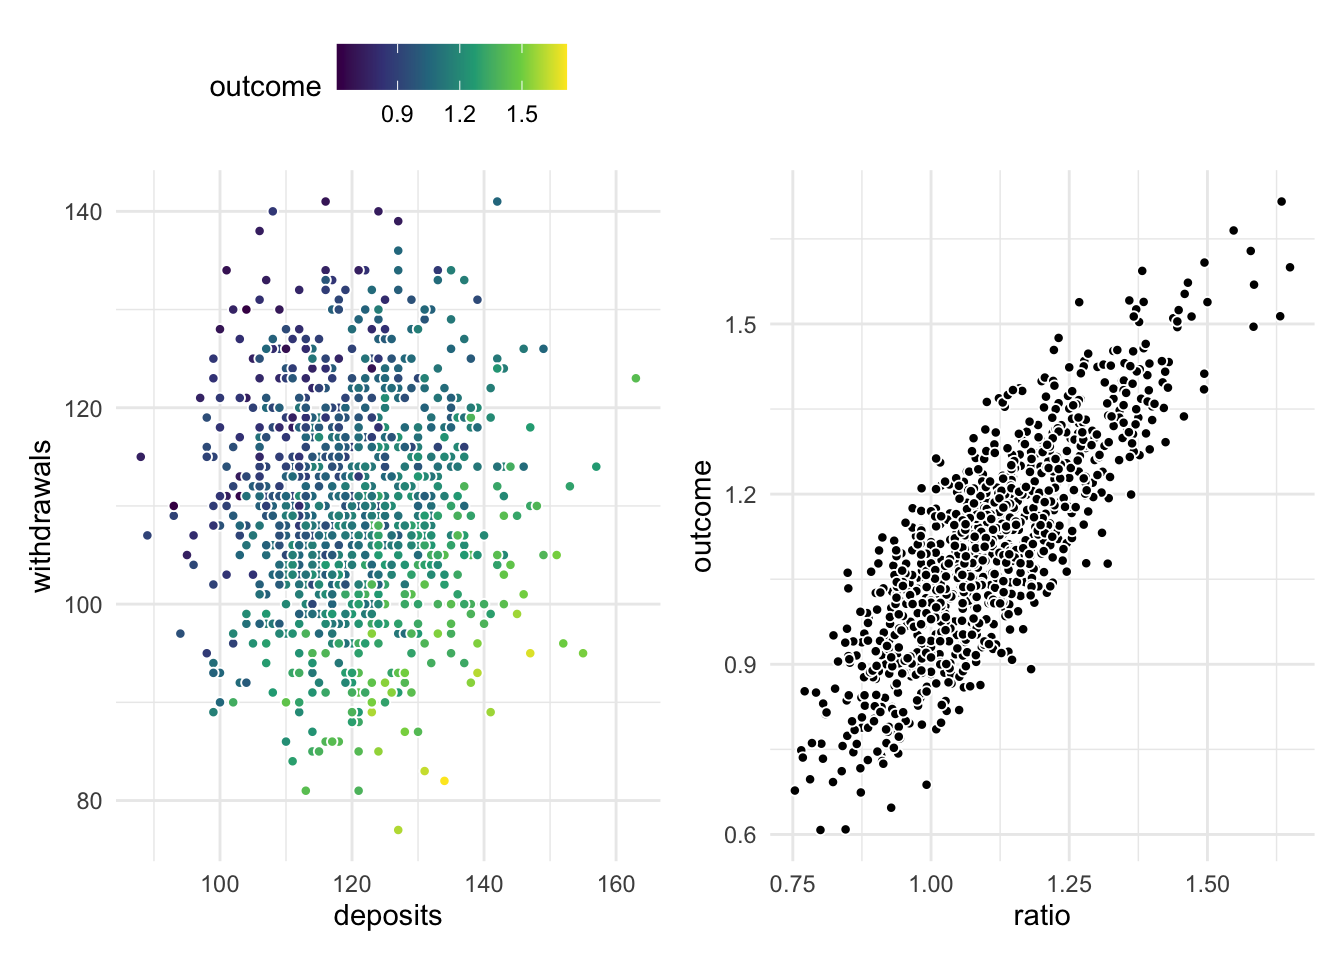
Below we are seeing such a ratio in action. This fictitious data set contains the number of deposits and withdrawals from some customers. There is a clear effect between the predictors deposits and withdrawals and the outcome variable, but they contribute to the outcome together. By taking the ratio between these two variables we get a singular variable that has a linear relationship with the outcome.
The ordering of these ratios doesn’t matter to the performance but can be helpful later on when we try to interpret the model later on. Another thing we often do is to take the logarithm of the resulting ratio to give us some better intervals.
We can do some of the same tricks with multiplication as well. This is also known as feature crosses. Again we can have features that jointly contain information that relates to the outcome, in a way that combining them multiplicatively is better explained.
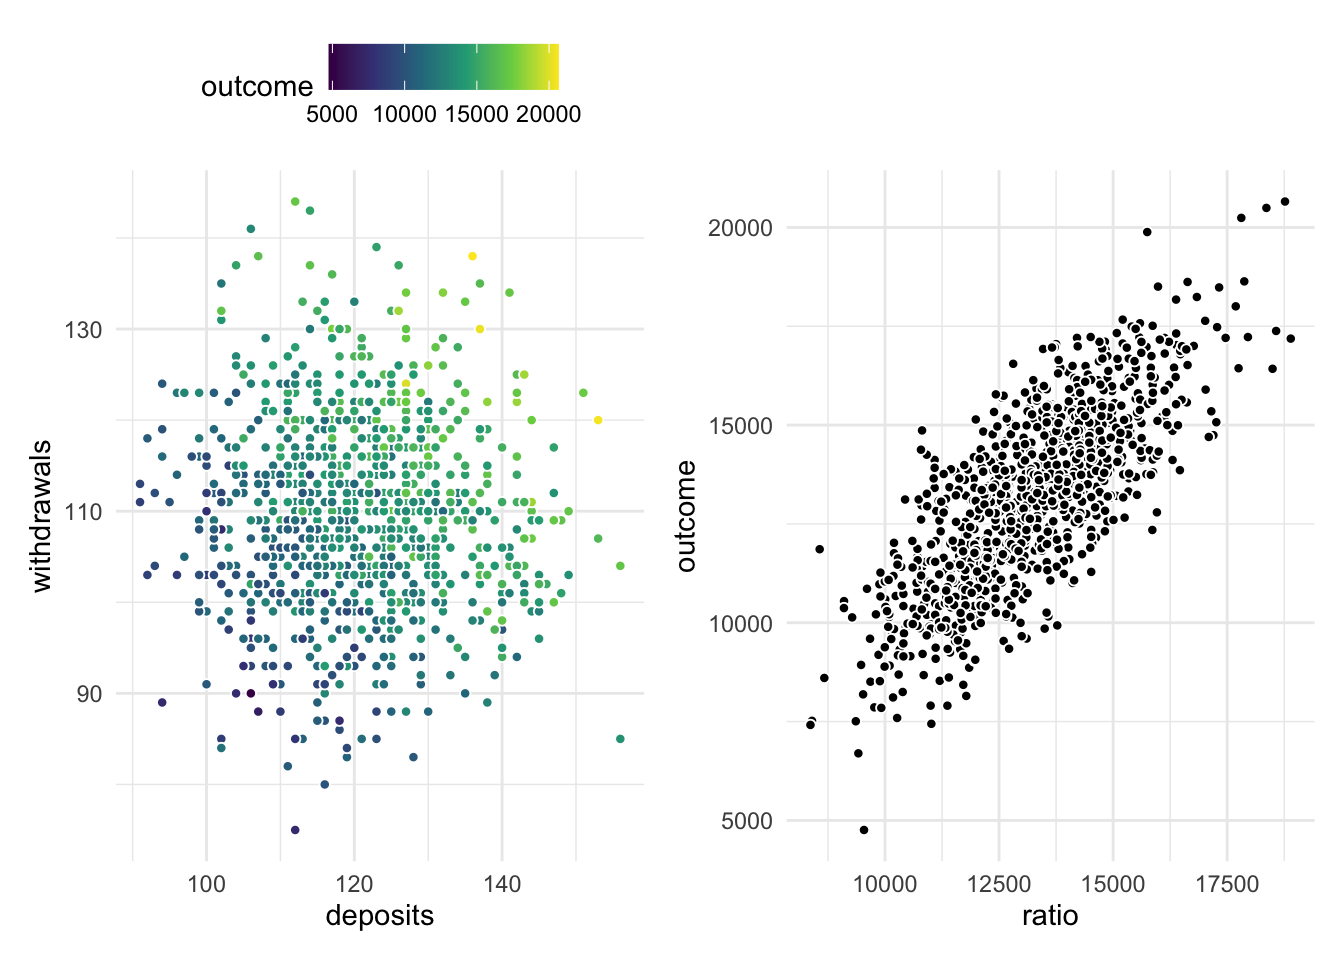
Ratios and crosses are in essence the same thing, with them being the same after the inversion of one of the variables. The same way division and multiplication are connected. Using these simple arithmetic operations we can combine 2 or more variables in ways that enhance our understanding of the data.
One could imagine that you could try all possible combinations for a set of variables and operations. That is likely to be too much as the number of created variables would increase exponentially, with each newly created variable being a candidate for future combinations. This is not to say that it is an impossible task but should be used as a last resort. Methods in Too Many section should be tried first.
14.2 Pros and Cons
14.2.1 Pros
- Create interpretable features
14.2.2 Cons
- Requires manual effort to find and create