65 Periodic Indicators
65.1 Periodic Indicators
There will be periodic signals that can’t be neatly modeled using sine curves or splines. Our last chance to deal with this type of data is by writing custom indicator functions and applying them.
This chapter is very similar in style to the Advanced Datetime Features chapter. With this chapter being the simpler case we don’t have to deal with the added complexity that comes with datetime variables.
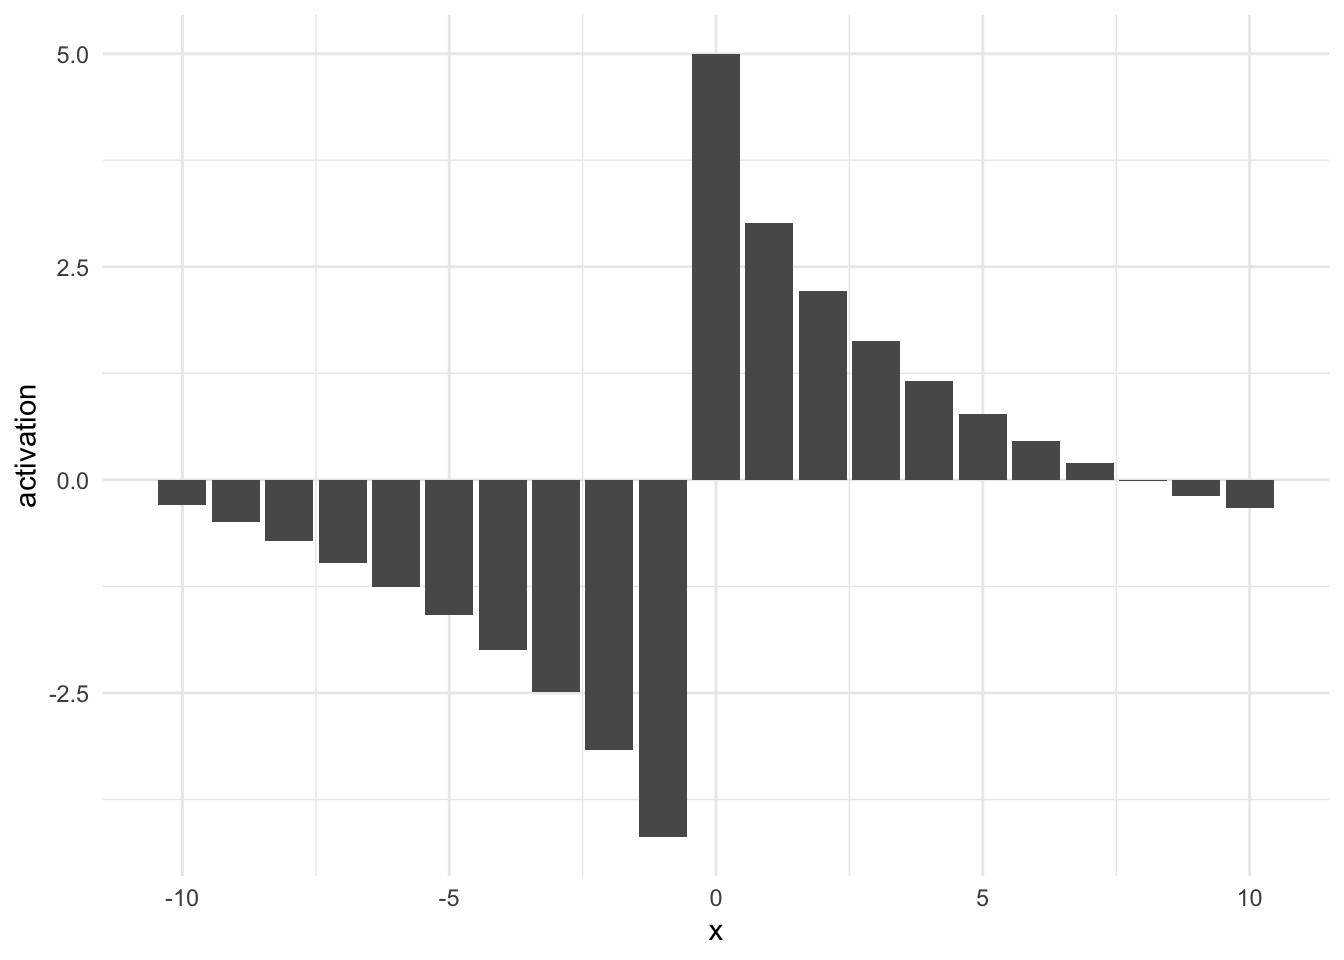
Above we see a type of activation we might see in some data.
Creating these features is mostly done by handcrafting. Making them periodic is done using a modulo operator, using the period.
65.2 Pros and Cons
65.2.1 Pros
- Can capture most a periodic signal
65.2.2 Cons
- Requires hand-crafted features