92 Tomek Link Removal
92.1 Tomek Link Removal
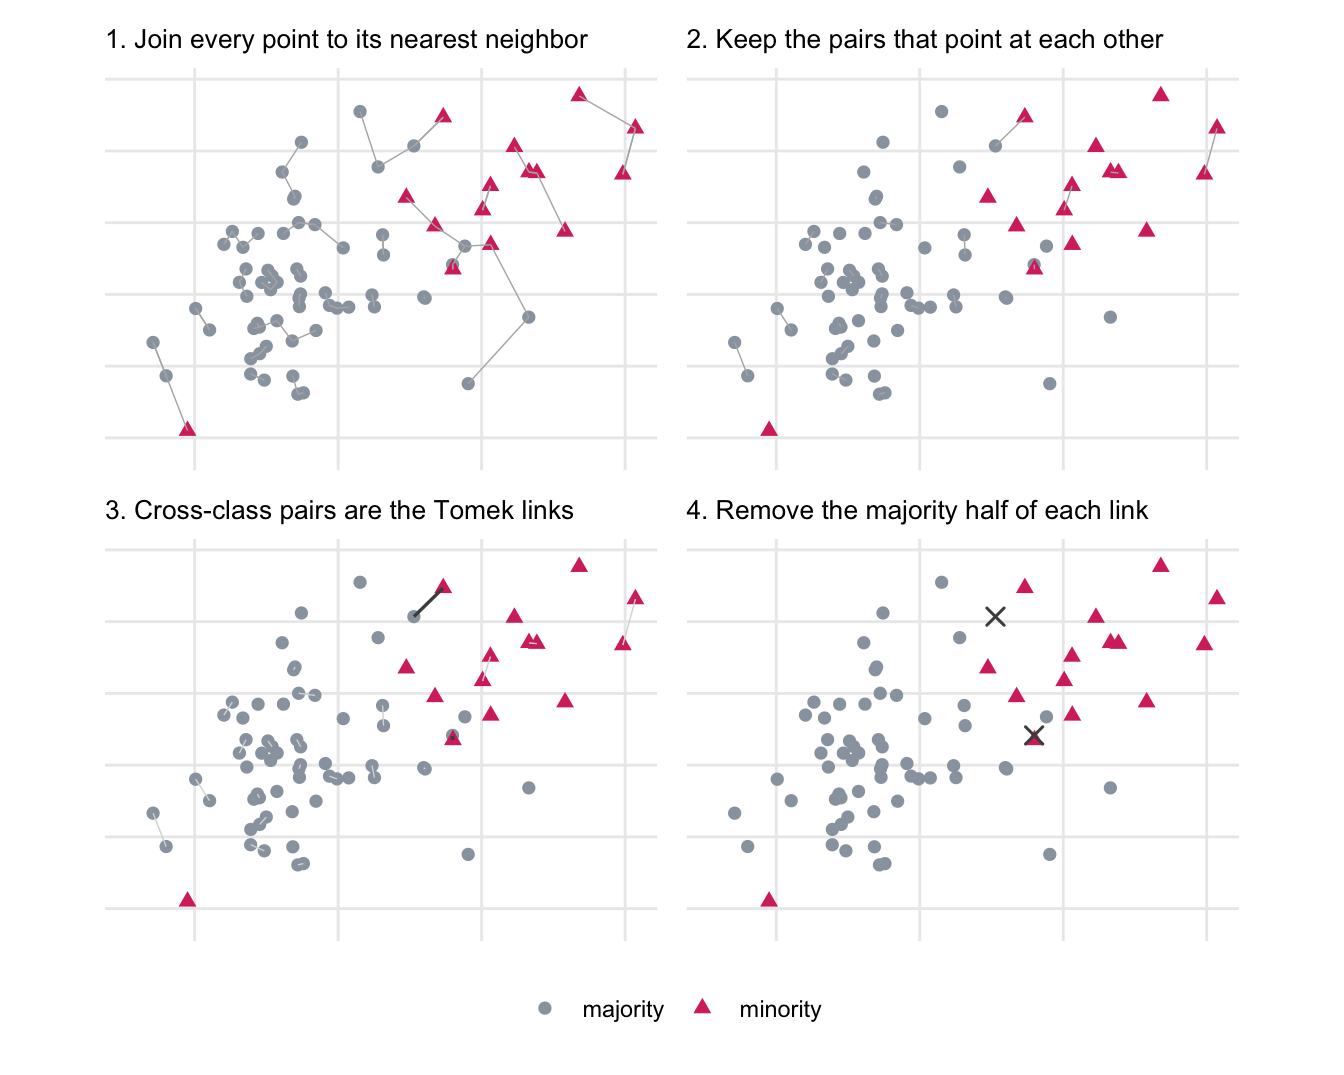
Tomek link removal is the practice of identifying Tomek links and removing them from the data set. A Tomek Link is a pair of observations from different classes that have eachother as their nearest neighbor (Tomek 1976). The Tomek link is typically handled by removing the majority observation of the pair instead of removing both observations.
Figure 92.1 shows how the links are found and what removing them does to the boundary between the classes.
The traditional implementation assumes Euclidean distances, which in turn assumes you have all numeric predictors and no missing values.
This method is computationally quite fast, as we are only doing one pass of nearest neighbor search. And that is used to identify observations that could be removed. We aren’t doing any sampling. However, on the other side, we don’t have many levers to pull for this method. It is un uncommon to have few or no points removed when applying Tomek Link removal.
The method also makes the assumption that the noise happens at the border between two classes, However, that is not true for all data sets.
Tomek link removal is one of the methods that needs no expanding at all, as described in Section 86.2. There is also no notion of importance, A point deep inside another class may or may not be removed purely based on how close it is to its nearest point.
Like all the methods in this section, this changes the distribution of the training data set, which is covered in Section 86.3.
TipAnimated version
The same walkthrough, one step at a time, is available as an animated slide.
92.2 Pros and Cons
92.2.1 Pros
92.2.2 Cons
92.3 R Examples
We will be using the same subset of the ames data set as in the up-sampling chapter.
library(recipes)
library(themis)
library(modeldata)
library(dplyr)
data("ames")

ames_imbalance <- ames |>
  filter(MS_Zoning %in% c("Residential_Low_Density", "Residential_Medium_Density")) |>
  mutate(MS_Zoning = droplevels(MS_Zoning)) |>
  select(MS_Zoning, Lot_Area, Year_Built, Gr_Liv_Area, Full_Bath)

ames_imbalance |>
  count(MS_Zoning)
# A tibble: 2 × 2
MS_Zoning n
<fct> <int>
1 Residential_Low_Density 2273
2 Residential_Medium_Density 462{themis} provides step_tomek(), which removes Tomek links.
recipe(MS_Zoning ~ ., data = ames_imbalance) |>
  step_tomek(MS_Zoning) |>
  prep() |>
  bake(new_data = NULL) |>
  count(MS_Zoning)
# A tibble: 2 × 2
MS_Zoning n
<fct> <int>
1 Residential_Low_Density 2182
2 Residential_Medium_Density 462